Balloon Navigator

Welcome to Balloon Navigator documentation! This page explains everything it is to know about Balloon Navigator. Use menu to move between sections.
If you have any questions not covered here, feel free to send an email to balloonnavigator@patrykkalinowski.com
Balloon Navigator is a Progressive Web App, which means it works inside internet browser. It doesn’t need to be installed to work offline. However, it relies on certain technologies which are not supported by all browsers on the market.
Recommended screen size is 9 inch or bigger.
4GB RAM is required to reliably run the app.
You need to have enough free disk space to save offline maps and waypoints. Minimum 2GB of disk space is recommended for small maps. More disk space is needed for country maps, as they can reach up to 2GB per file.
While Balloon Navigator will work fully online and offline without installation after first launch, it is recommended to install it on your system as separate app. This will make it easier to start (no need to remember web address, just app name) and ensure your browser won’t delete stored data if you didn’t use the app for a longer time, or when you clear cookies and browser history.
Open balloonnavigator.com/app in Chrome and click small computer icon with a down arrow on the right side of address bar

You will be prompted to install Balloon Navigator:
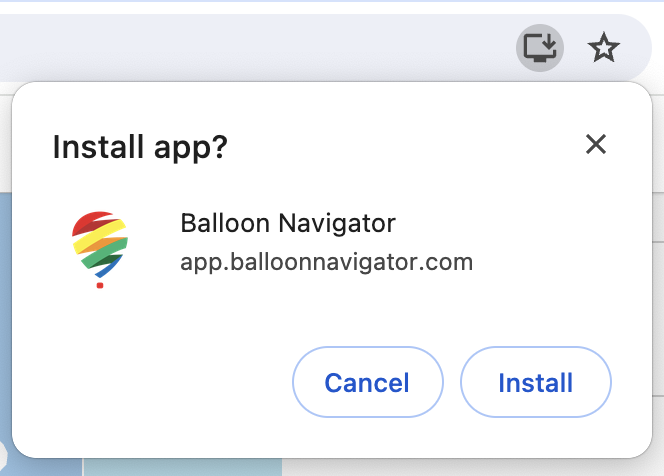
Click Install. App will open in separate window.
Balloon Navigator can now be started from the launcher, home screen, start menu, or launchpad (depending on your system).
Open balloonnavigator.com/app in Chrome. You will be prompted to install Balloon Navigator - tap Install.
If the prompt doesn’t appear, tap the three-dot menu in the top right corner of Chrome and select Add to Home screen, then Install.
Balloon Navigator can now be started from your home screen or app drawer, just like a regular app.
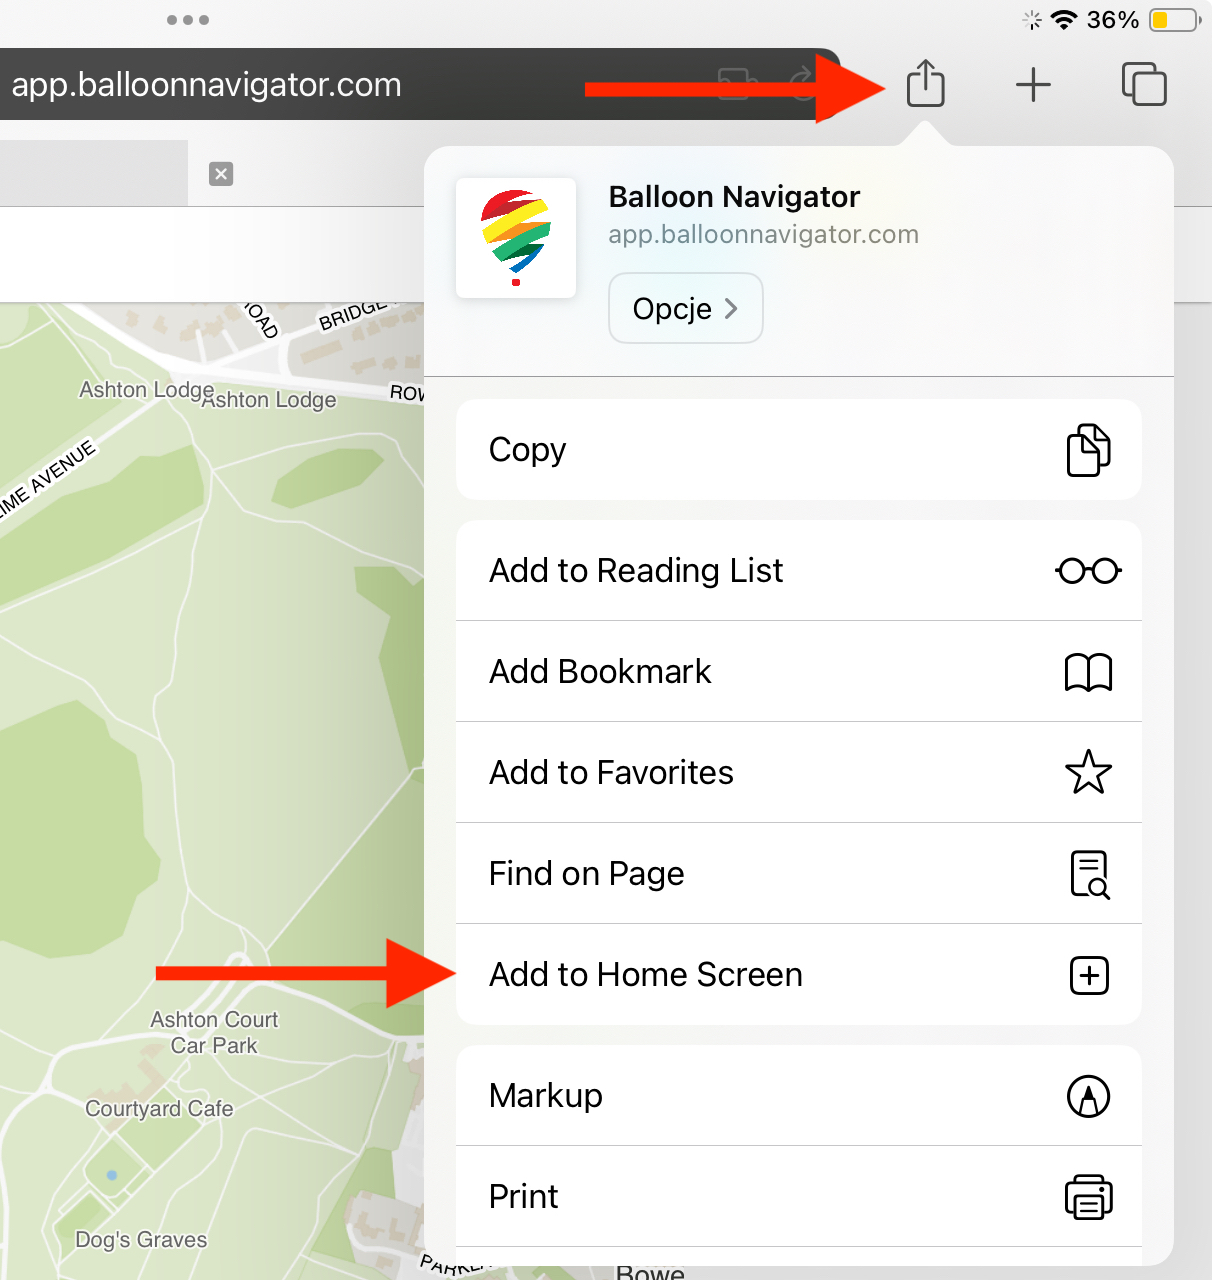
Open balloonnavigator.com/app in Safari and in top right corner, click Share button, then select Add to home screen.
Browser and installed versions of the app use separate database instances, which means your data (waypoints, tracks) won’t carry over. It’s best to install the app right away and be done with it.